Visualize high-dimensional dataset in a 2D Chart.
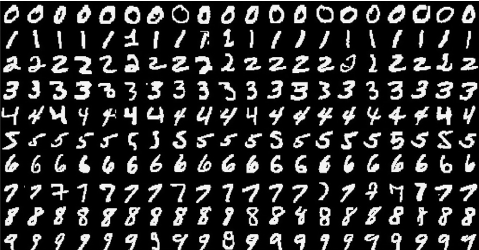 In this post, I'll use a
well known dataset MINIST
handwritten. There are
70,000 images, each image in
this dataset is of size 28x28.
First, import the libraries we are going to use.
import matplotlib.pyplot as plt |
I'm using matplotlib and seaborn for
visualization. numpy and pandas to handle
numerical arrays and dataframe. I'm also use scikit-learn
to get the data and perform t-SNE.